Atrial Fibrillation (AF) is often described as an irregularly irregular rhythm. AF is an arrhythmia with no consistent ventricular response or pattern due to its somewhat random and chaotic discharging of atrial impulses firing disconnectedly from multiple foci. This continuous and erratic behavior results in a ventricular response that changes from beat to beat. AF will typically present with a ventricular response of 40-200 bpm but can vary throughout the duration of the arrhythmia depending upon activity, medication, and time of day. Atrial rates are usually in the 200-300 bpm range. During AF, the ventricles are not driven by any particular atrial focus but by the atrial impulse that penetrates the AV node. Subsequently, the AV node determines which signals will be passed to the ventricles depending upon its refractoriness and the frequency of atrial impulse attempts seeking to penetrate it. There is no organization apparent in this AV node conduction process.
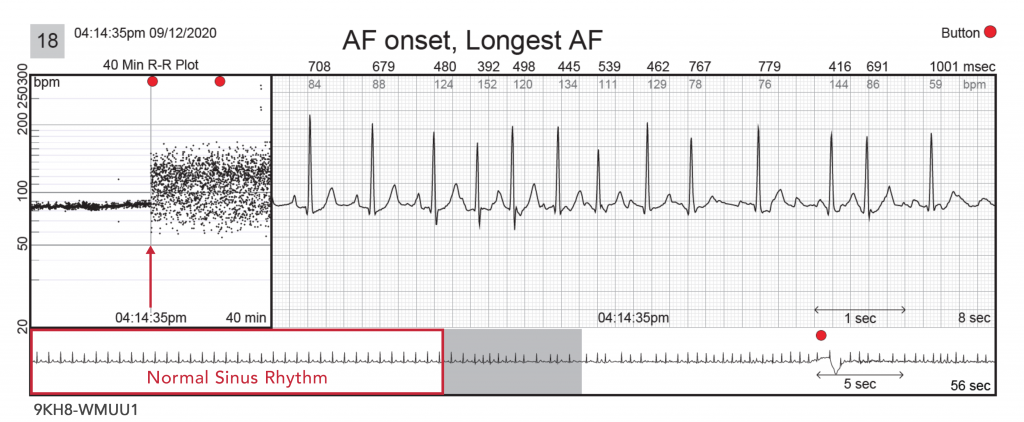
79-year-old female with a past history of AF monitored for recurrence. This patient had a single 1.2-hour episode recur at 4:14 pm while at rest. In strip #18 below, the standard ECG shows three NSR beats followed by a PAC that initiates AF with clear variable P-wave morphologies. The slower speed ECG at the bottom demonstrates stable NSR prior to AF onset (outlined by the red box). This slower speed strip also shows a button press approximately 20 seconds after AF onset indicative of patient awareness of the AF onset. The associated near-term R-R plot (20 minutes pre-AF and 20 minutes post-AF onset) on the left shows a clear change from NSR to AF (red arrow) which is further confirmed on the associated standard and intermediate ECG strips. The long-term, continuous R-R plot (shown on page 2 of all Carnation reports) can be quite helpful when trying to identify the burden and diurnal trends presented during wear time for patients with intermittent AF. The continuous R-R plot offers the physician a high-level overview of when and how often a patient was in AF both quantitatively and qualitatively. Diurnal patterns in arrhythmia onset and offset can also aid in optimizing drug dosing schedules. The full report can be viewed by clicking the link here.
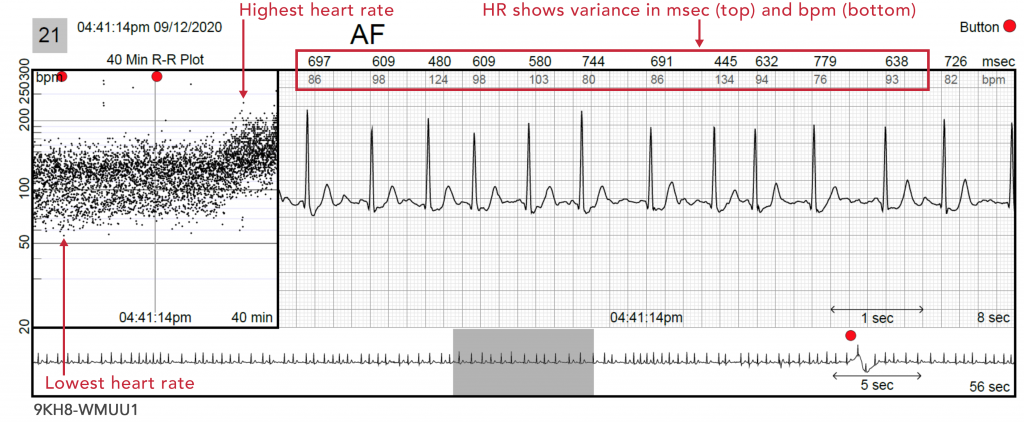
Strip #21 below shows the ease of identifying AF by its characteristic manifestation on the R-R plot. This pattern is sometimes called an AF “cloud.” The R-R plot will generally display a spread of dots, with a Gaussian-like distribution of heartbeats, due to the erratic behavior of AF conduction through the AV node. Late in the 40-minute R-R plot, one can see a rise in the AF cloud representing a significant rise in mean and maximum heart rate. These types of significant changes in AF heart rate may provide clinical clues to symptoms, cardiovascular pathophysiology, and/or effectiveness of medications.
In the near-field ECG view, heart rates are displayed in both msec and bpm (narrow red rectangle). This can be helpful when trying to determine AF that may seem regular but is not. On this ECG tracing, we can see that the heart rates are not regular, and the atrial activity is not organized, which is consistent with AF.
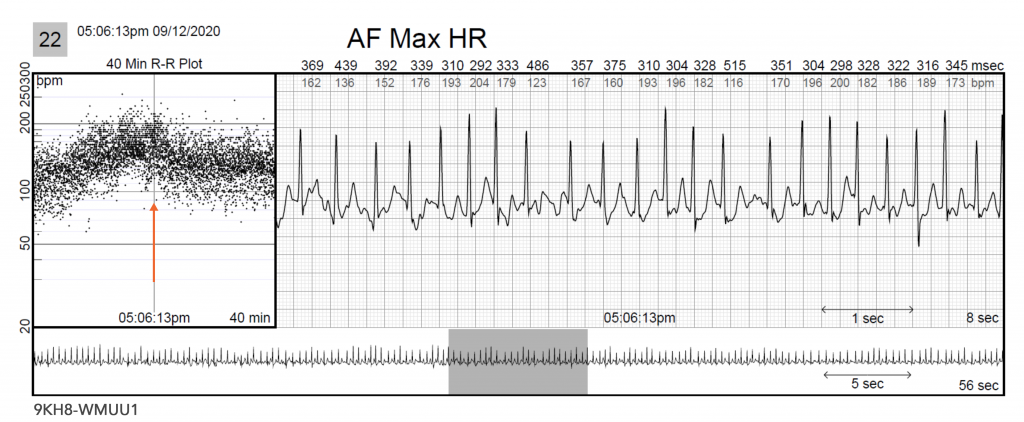
Strip #22 below shows a sudden increase in AF rates over a 10 to 15-minute period (orange arrow) approximately 50 minutes after AF onset. This change should trigger the question, “Why?” Is this accelerating in rate due to anxiety, worsening heart failure, or activity? This R-R finding can aid in diagnosing not only the presence of AF but also the patient’s response to it.
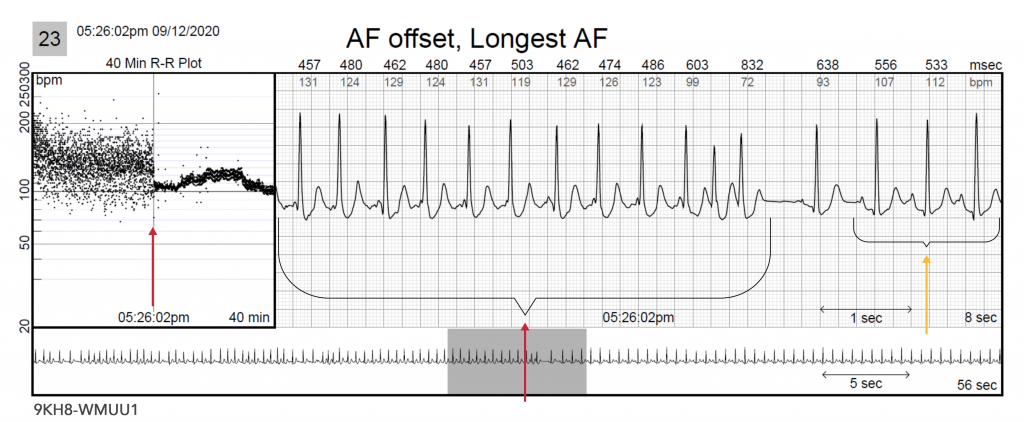
Strip #23 below shows the termination of AF (red arrows) and the transition to sinus tachycardia (yellow arrow). The fact that the return to sinus rhythm is at a higher rate than at the onset of AF is an indication that the AF created a catecholamine surge. The further rise in sinus rate approximately 5-10 minutes after AF termination may provide further clues as to the physiological effect of AF on this patient’s cardiovascular condition.
US-FLC199-220028 (v1.0) 10/2022